 Due to the recent surge in applications and the growing unpredictability in students’ college decisions, the use of college waitlists has also become harder to forecast. Many schools vary their usage of waitlists from year to year, based on how many students they want to accept, as well as the “yield,” or percentage of admitted students who choose to attend. Students can hear about waitlist admission at any point between May 1st and late August.
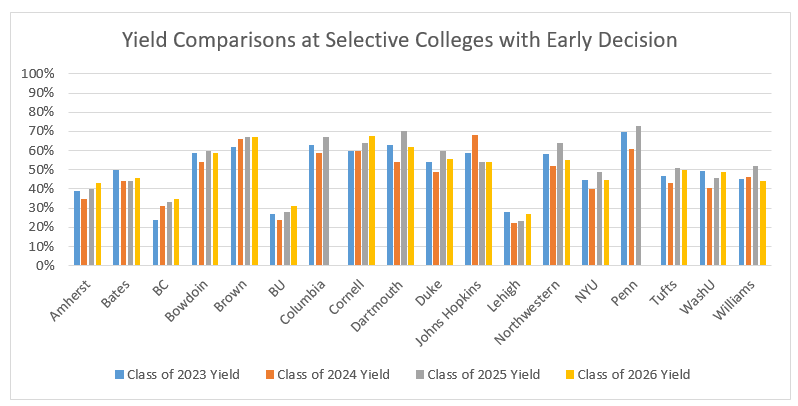
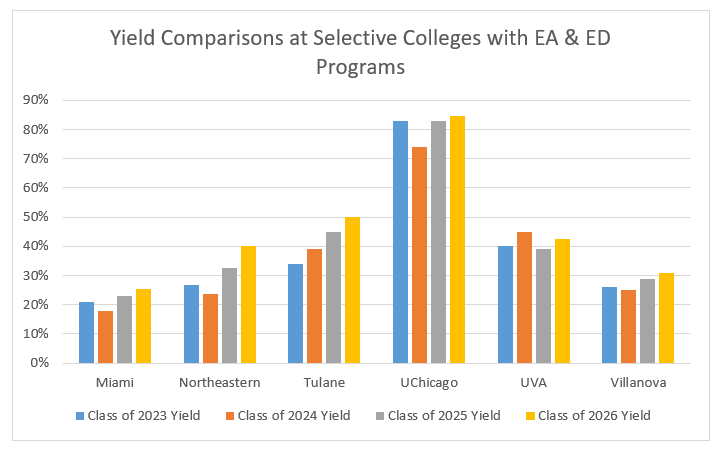
Yield, the percentage of students who accept offers of admission, remained steady or increased at many selective schools for the Class of 2026. Although college enrollment overall is decreasing, student interest in attending the most selective schools is increasing, as reflected in the charts below. Early Decision programs also play a role in increasing yield. For example, Tulane’s yield rose to 50% last year as the school now fills almost 68% of the incoming class through its Early Decision I/II program. In 2016, Tulane’s yield was only 26%.
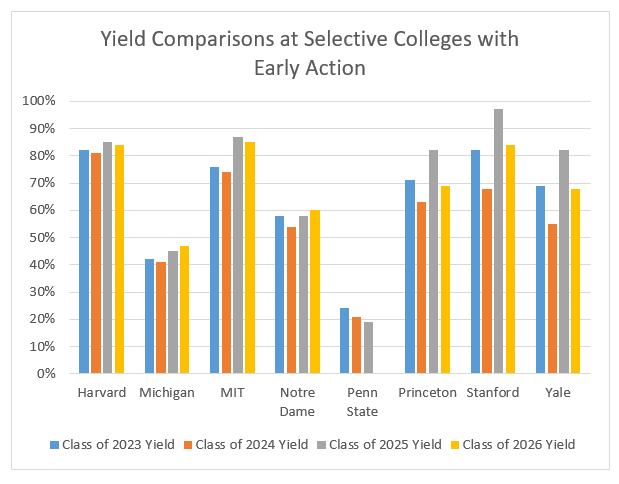
Of course, yield can fluctuate and last year, Stanford, Harvard, and MIT all had yields around 85%, and Princeton and Yale’s yields were near 70%. All of these rates were lower than the yields for the Class of 2025 at these institutions, when Stanford was close to 100% yield and the others were slightly higher than last year.
For perspective, a yield of 45% or higher is considered very strong and indicative of a highly selective program. NACAC’s (National Association of College Admissions Counseling) most recent State of College Admission Report in 2019 stated that the average yield rate for first-time freshmen was holding steady at 34%.
As colleges struggle to predict the responses of admitted students, their use of the waitlist will depend on a variety of factors, including yield, deferrals, and institutional priorities. It is notable that many schools saw a dip in yield for the Class of 2024, most likely caused by uncertainty as a result of the pandemic. See the charts below, of yield comparisons at selective colleges with Early Decision and Early Action, for the classes of 2023 through 2026.
How Likely is Waitlist Admission?
It is important for applicants on a waitlist to be realistic about their chances. Although being placed on a waitlist is more hopeful than being denied, the NACAC survey reported that overall only 20% of students were accepted after taking waitlist positions and only 7% were admitted off a waitlist position to the most selective colleges.
When colleges accept students from the waitlist, they are typically looking at how many spots still need to be filled in the freshman class; which majors, residency locations, or other “hooks” are needed to round out this particular class; and how likely you are to attend if admitted. Consider how your top college choices have used their waitlists in the past.
Analysis of Historical Waitlist Data
Here are a few case studies of both public and private colleges with a range of selectivity, including Cornell, Lehigh, Stanford, University of California-Berkeley, University of Miami, University of Michigan, and University of Pittsburgh. These case studies illustrate the enormous variation year to year, and from college to college, as well as the many factors that can impact the use of waitlists.
Highly Selective Schools
For perspective on how waitlist use can vary from year to year, the charts below show a comparison among several highly selective schools of Waitlist Accepted Offers versus Waitlist Admission from 2018 to 2022. These highly selective schools have an overall admit rate that is under 10%.
Cornell University. Cornell had been accepting about 150 or more students from the waitlist from 2018-2020, but in 2021, only 24 students were accepted from a group of 5,800 students who had accepted the waitlist offer. This could be due in part to an increase in yield that year, and perhaps issues related to over-enrollment, which was common after the pandemic. However, for the Class of 2026, 260 students were offered admission from the waitlist, even though yield continued to increase.
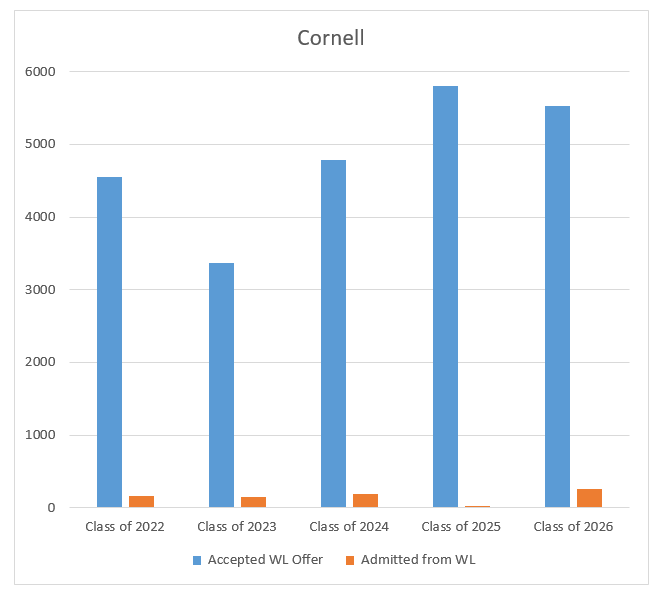
| Cornell | Accepted WL Offer | Admitted from WL | % Accepted from WL |
| Class of 2022 | 4,546 | 164 | 3.6% |
| Class of 2023 | 3,362 | 147 | 4.4% |
| Class of 2024 | 4,791 | 190 | 4.0% |
| Class of 2025 | 5,800 | 24 | 0.4% |
| Class of 2026 | 5,531 | 260 | 4.7% |
Stanford University. Like many schools that were grappling with uncertainty caused by the pandemic, Stanford also shows a significant jump in the use of their waitlist for the Class of 2024, which then steadily declined.

| Stanford | Accepted WL Offer | Admitted from WL | % Accepted from WL |
| Class of 2022 | 681 | 30 | 4.4% |
| Class of 2023 | 580 | 8 | 1.4% |
| Class of 2024 | 707 | 259 | 36.6% |
| Class of 2025 | 535 | 61 | 11.4% |
| Class of 2026 | 457 | 8 | 1.8% |
Other Selective Private Schools
At another category of schools, selective private, the use of waitlists also varies year to year. Their overall acceptance rates are greater than 10% but less than 40%.
Lehigh University. Lehigh’s waitlist can have either a lot of movement or very little, due in part to yield below 30%. From 2018-2020, the number of students on the waitlist declined steadily, while the number of students who accepted waitlist offers increased steadily – culminating in the surprising development for the Class of 2024, in which 90% of those who accepted a waitlist offer were admitted. Yet for the Class of 2025, that number fell to only 5%. Over the past few years, some schools like Lehigh are making more offers of admission before turning to the waitlist after May 1.

| Lehigh | Accepted WL Offer | Admitted from WL | % Accepted from WL |
| Class of 2022 | 3,358 | 69 | 2.1% |
| Class of 2023 | 2,480 | 1,307 | 52.7% |
| Class of 2024 | 1,875 | 1,684 | 89.8% |
| Class of 2025 | 2,079 | 102 | 4.9% |
| Class of 2026 | 2,499 | 93 | 3.7% |
University of Miami. Looking back the past five years, Miami has admitted as few as 13 waitlisted students and as many as 781. They fall into the general pattern of admitting many waitlisted students in 2020, when pandemic uncertainty was high, and admitting very few waitlisted students in 2021. In 2021, Miami’s yield rose 5 percentage points to 23% and over 400 more students accepted offers of admission compared to the previous year, prompting little use of the waitlist. Last year, Miami saw a surge in the number of applicants accepting a spot on the waitlist, from 4,643 in 2021, to 8,545 in 2022. Therefore, even though 115 applicants were admitted from the waitlist last year, it was only a little over 1% of the large list.
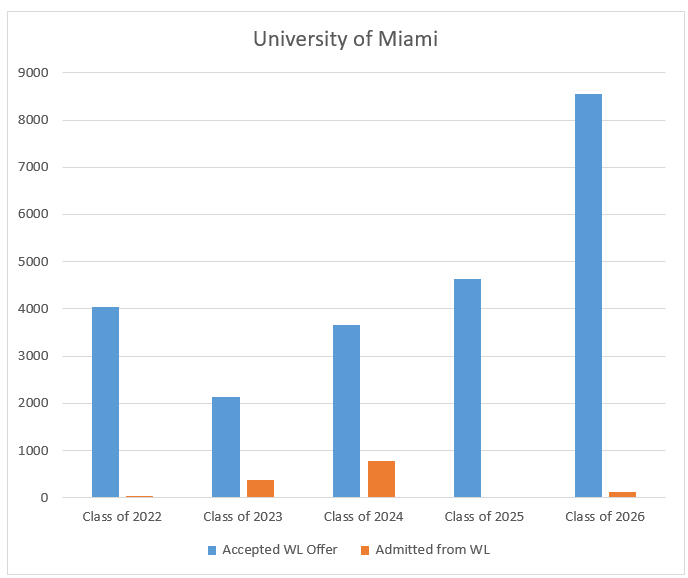
| University of Miami | Accepted WL Offer | Admitted from WL | % Accepted from WL |
| Class of 2022 | 4,041 | 30 | 0.7% |
| Class of 2023 | 2,143 | 366 | 17.1% |
| Class of 2024 | 3,664 | 781 | 21.3% |
| Class of 2025 | 4,643 | 13 | 0.3% |
| Class of 2026 | 8,545 | 115 | 1.3% |
New York University. According to NYU’s Admissions office,
“The number of students who have been admitted from the waitlist has varied widely in previous years. While during one recent year, we were not able to admit any students from the waitlist, in others we were able to admit hundreds of students. Again, the number of admission offers we can extend is contingent on the number of responses we get to our initial offers of admission, and we will have a better idea of what space is available after the admitted student response deadline.”
Tulane University. In contrast, some schools have not turned to their waitlist at all. Tulane has been focused on increasing yield through its ED program. While they offer waitlist spots, last year only 3 students were admitted from waitlist and the last time before that was in 2018, when two people were admitted. So do not expect to get off the waitlist there!

| Tulane | Accepted WL Offer | Admitted from WL | % Accepted from WL |
| Class of 2022 | 3,111 | 2 | 0% |
| Class of 2023 | 1,371 | 0 | 0% |
| Class of 2024 | 4,486 | 0 | 0% |
| Class of 2025 | 1,871 | 0 | 0% |
| Class of 2026 | 2,271 | 3 | 0% |
Selective Public Universities
Among prestigious public universities, there is also much variation in waitlist use each year.
University of Michigan. Last year, the number of students who accepted their waitlist offer at Michigan rose to over 15,000 (72% of offers were accepted) and only 77 students were admitted from the waitlist (1%).
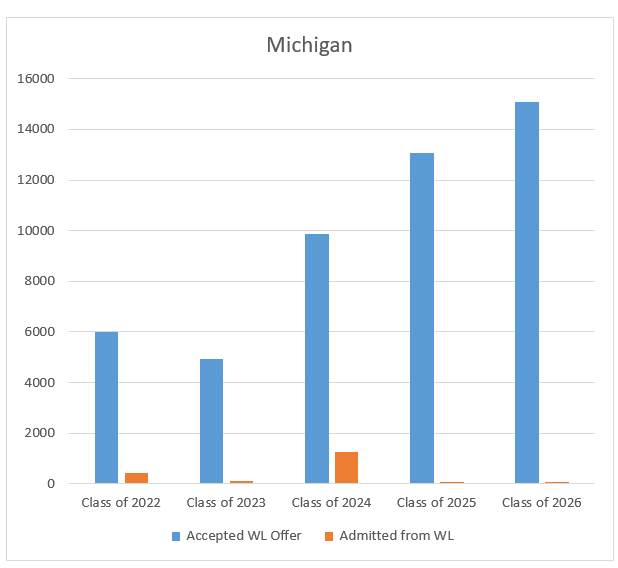
| Michigan | Accepted WL Offer | Admitted from WL | % Accepted from WL |
| Class of 2022 | 6,000 | 415 | 6.9% |
| Class of 2023 | 4,922 | 89 | 1.8% |
| Class of 2024 | 9,856 | 1,248 | 12.7% |
| Class of 2025 | 13,063 | 68 | 0.5% |
| Class of 2026 | 15,076 | 77 | 0.5% |
UC-Berkeley. At UC-Berkeley there has been a fairly steady use of the waitlist from 2018-2020, averaging around 1,400 admitted students. However, last year only 44 waitlisted students were admitted. For the Class of 2025 and 2026, larger classes enrolled (6,931 and 6,726 students, respectively) compared to the Class of 2024, when only 6,117 students enrolled. UC-Berkeley has also been increasing the number of admissions offers extended in the regular admissions cycle. As their yield increased over the past three years, their use of the waitlist decreased.
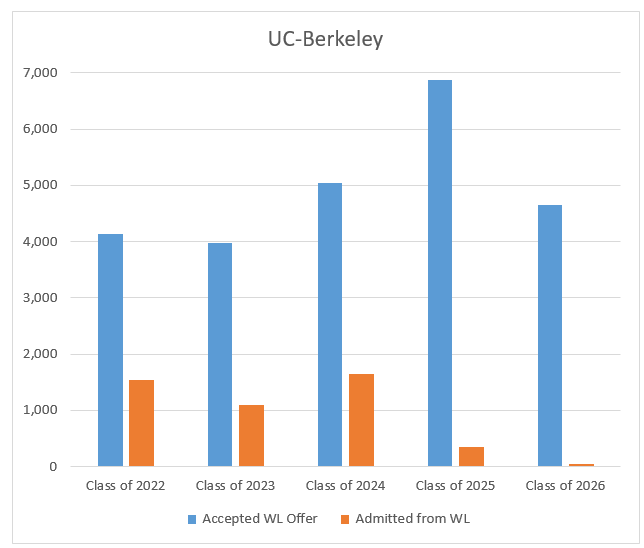
| UC-Berkeley | Accepted WL Offer | Admitted from WL | % Accepted from WL |
| Class of 2022 | 4,127 | 1,536 | 37.2% |
| Class of 2023 | 3,975 | 1,098 | 27.6% |
| Class of 2024 | 5,043 | 1,651 | 32.7% |
| Class of 2025 | 6,871 | 359 | 5.2% |
| Class of 2026 | 4,655 | 44 | 0.9% |

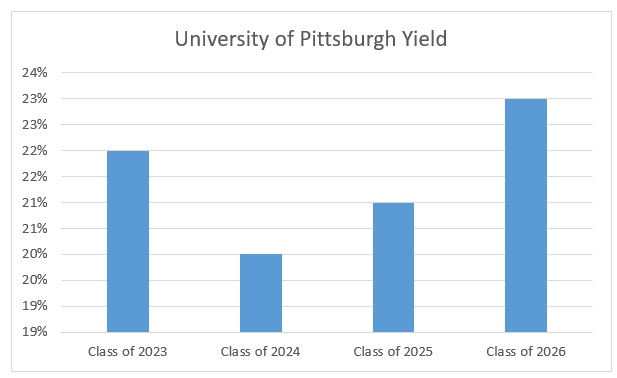
The University of Pittsburgh provides yet another snapshot of how unpredictable waitlists can be. For the Class of 2025, only 1% of the waitlist was admitted, and then for the Class of 2026, 44% were admitted. Overall Pitt’s yield has averaged around 22% over the past four years and its applications have surged from 32,549 in 2020 to 53,062 in 2022. It is very difficult with those high numbers to predict who will attend if accepted.
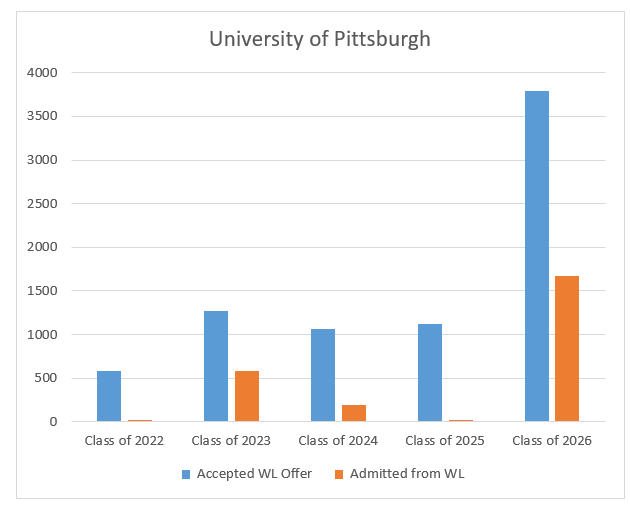
| University of Pittsburgh | Accepted WL Offer | Admitted from WL | % Accepted from WL |
| Class of 2022 | 576 | 24 | 4.2% |
| Class of 2023 | 1,266 | 578 | 45.7% |
| Class of 2024 | 1,061 | 193 | 18.2% |
| Class of 2025 | 1,116 | 16 | 1.4% |
| Class of 2026 | 3,791 | 1,666 | 43.9% |
If you want to get a sense of your chances, it is very important to look up waitlist information in the Common Data Sets for your top schools. If the number has been close to zero in the past (as with Tulane), it might be time to move on. If the number is in the hundreds or thousands, then reach out and show your interest!
Tips for Improving your Chances of Waitlist Admission
#1 Let the college know that you want to stay on the waitlist! Make sure you also commit and deposit at your top choice of your admitted schools.
#2 Send a letter to the waitlist college expressing your continued interest, and include any updated information about academics or activities since you last contacted them. In your letter, be genuine. If you would attend if accepted, say so. If not, state that you remain strongly interested in the college. If you have re-visited since you applied, discuss the specifics of your visit in your note. Summarize why the college is an excellent fit for you and mention unique strengths and experiences you would contribute to campus. If appropriate, include updates on awards, special academic achievements, or extracurricular projects that have occurred since you submitted your original application.
#3 Find out if the college will accept additional information, such as grades or letters of recommendation. Look at the college website and your waitlist offer to see what new information the college is willing to receive, if any. Colleges vary widely in this regard.
#4 Stay engaged in your academics. Colleges will be reviewing your senior year final grades. Strong grades will strengthen your chances of acceptance at your waitlist colleges.
If you would like assistance in writing a letter of continued interest, weighing your college admissions options, or with any other aspect of high school planning and college admissions, contact Collegiate Gateway. As always, we’re happy to help!
![]()
![]()
![]()
![]()