 In recent years, the number of people applying to med school has reached an unprecedented high. Enrollment numbers have increased, too: the latest figures put overall medical school enrollment at 96,520, an almost 18% increase over the past decade. This surge has been made possible by increasing class sizes, the opening of more medical schools, and government intervention to add Medicare-supported graduate medical education positions, and is a welcome response to the projected shortage of physicians in the coming years. (Whether there are enough postgraduate medical opportunities is another matter.)
The upshot: more people are applying to and attending med school. Interestingly, the admit rate of applicants admitted to at least one medical school has remained relatively constant over the past decade at about 40% each year. (We are proud that 94% of our med school applicants have received at least one medical school acceptance!) In the post below, we walk through more detailed trends in medical school admissions in recent years, including the makeup of applicant and matriculant pools by gender, race and ethnicity, and socioeconomic status.
Broad application and admissions trends
To get granular, the total number of applicants to MD-granting med schools peaked in the mid-1990s, then dipped through the early 2000s, and has been steadily rising since then, eclipsing that mid-1990s peak. The graph below, via the AAMC, gives a visual of this trend:
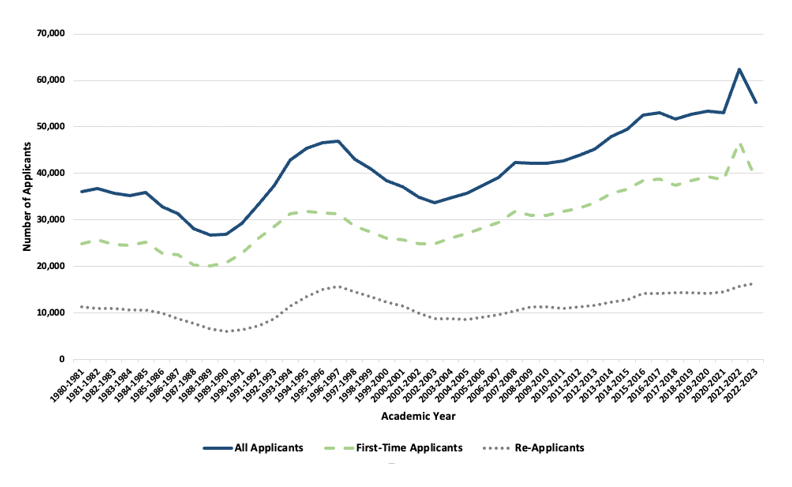
Source: AAMC 2023
You’ll notice a spike in the number of applicants in 2021-2022—an 18% increase over the prior year, to be exact—which was a function of a variety of COVID-related factors. The number of applications has since returned to around pre-COVID levels. The data also show that the number of first-time applicants to MD programs has followed a similar progression as the total number of applicants (which makes sense, since they comprise the majority of applicants).
Reapplicants have represented 28% of total applicants over this 40-year time period, and around 27% of total applicants over the past decade. The AAMC doesn’t publish data about the med school acceptance rate for reapplicants versus first-time applicants, but presumably reapplicants use the additional year to evaluate their weaknesses in their initial application and bolster their candidacy.
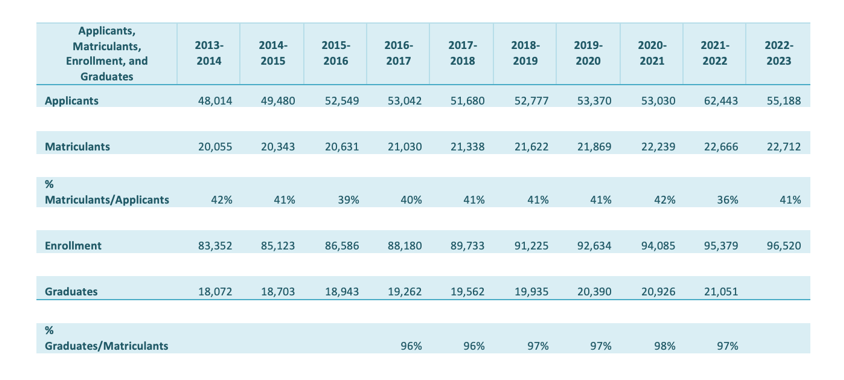
As for the percentage of applicants admitted to schools, that figure has remained pretty constant over the past decade, at 39-42%. (The figure temporarily dipped to 36% in 2021-2022 due to the COVID application spike, then returned to 41%.) As for the number of med school matriculants who graduate from their programs, the figure has held at an impressive 96-98% over the past decade. See the following chart, which includes data from the AAMC, as well as our calculations of (a) the percent of matriculants over applicants and (b) the percent of graduates over matriculants.
Trends by demographic factors
The medical profession is committed to increasing diversity of its medical school classes and future physicians. David J. Skorton, MD, AAMC President and CEO, says: “We know that more diversity in the physician workforce builds trust and enhances the physician-patient relationship, translating into better health outcomes,”
Gender Diversity. Since 1980, more men than women matriculated into MD programs—that is, until 2017-2018, when that ratio inverted! The graph below shows the number of female matriculants steadily increasing over the past two decades as the number of male matriculants stayed relatively constant:
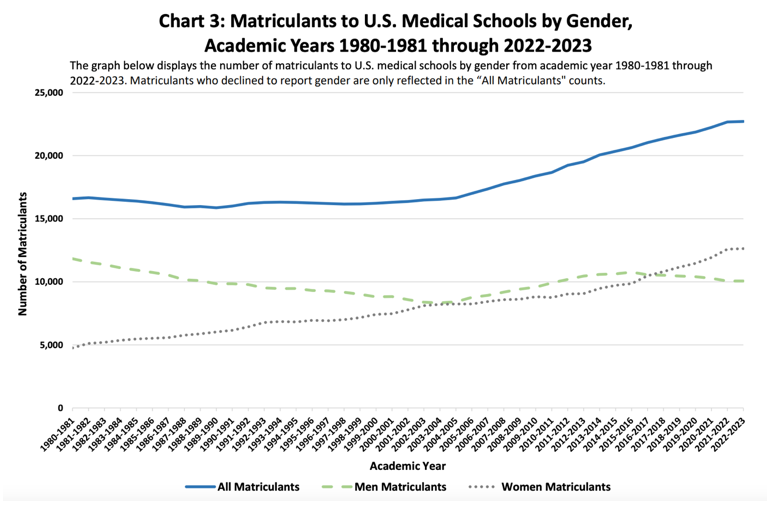
Source: AAMC 2023
This trend in the gender breakdown of med school classes follows a similar development in the makeup of the applicant pool: between 2012 and 2022, the number of men applying to med school held steady at around 24,000, while the number of women applying jumped from around 21,000 to over 31,000. So, it’s not that it’s become easier to get in as a woman—rather, more women are pursuing medical education in the first place. (In fact, the percentage of women accepted is a few points lower than the percentage of men accepted.)
Racial and Ethnic Diversity. In recent years, med school classes have also become more racially and ethnically diverse. Between 2015 and 2022, the percentage of white matriculants declined from 57% to 52%, while the percentage of Asian matriculants increased from 22% to 29%; Black or African American matriculants, from 8% to 10%; and Hispanic, Latino, or Spanish matriculants increased from 10% to 12%. As with the gender breakdown, these figures are in line with the makeup of the broader applicant pool.
Socioeconomic Diversity. Data from the AAMC also shows increased socioeconomic diversity among applicants and matriculants to med school. Between 2020-2021 and 2022-2023, the percentage of matriculants “with a parent whose highest level of education was less than a bachelor’s degree or any degree with an occupation categorized as ‘service, clerical, skilled, and unskilled’” increased from 21% to 22%.
In short, the overall number of people applying to and attending med school is growing, and classes are becoming more diverse along multiple axes.
For guidance on navigating the complexities of the medical school application process, feel free to contact us. As always, at Collegiate Gateway, we’re happy to help!
![]()
![]()
![]()
![]()