 For the Class of 2027, early applications continued to increase at many highly selective schools, and as a result, early acceptance rates remained low or dropped further. Most schools continued to offer test-optional admissions after the success of previous admissions cycles during COVID, and in-person college visits seem back to pre-pandemic times. Congratulations to all students who submitted early applications—your perseverance will benefit you in the admissions process!
Contact us for a free consultation!
Whatever your early admissions outcomes, it is important to have an open mind and to maintain faith in the process of finding your best-fit school. In this blog post, we have put together an in-depth analysis of this year’s early admissions trends and statistics, as well as tips for future early applicants.
Overall Early Application Trends
Early admissions continued to soar, as more students apply early decision to demonstrate interest, increase their chances, and gain some certainty. Also, test-optional plans at selective schools could continue to encourage some students to try their luck at colleges which previously seemed out of reach.
Most selective schools experienced a slight rise in early application numbers that continue to be very high. Colleges that continue to break early application records and whose numbers rose from last year, include Barnard (up 11%), Brown (up 10%), Dartmouth (up 14%), Emory (EDI up 10%), Notre Dame (up 15%), NYU (up 14%), UVA (ED up 22% and EA up 17%), WashU (EDI up 12%), and Williams (up 16%). USC added Early Action to its admissions cycle for the first time this year and received a whopping 40,600 early apps! USC admitted 5.9% of EA applicants and deferred all applicants who were not accepted.
Colleges that continued to see high early application numbers that only rose slightly or stayed relatively flat compared to last year include Boston College, Penn, and Rice.
Some schools did see a drop in early applications. For example, Columbia’s ED apps fell by 9% from last year. MIT’s Early Action applications dropped 19% compared to last year, which is not surprising since MIT reinstated their standardized testing requirement this cycle after two years of a test-optional policy during the pandemic.
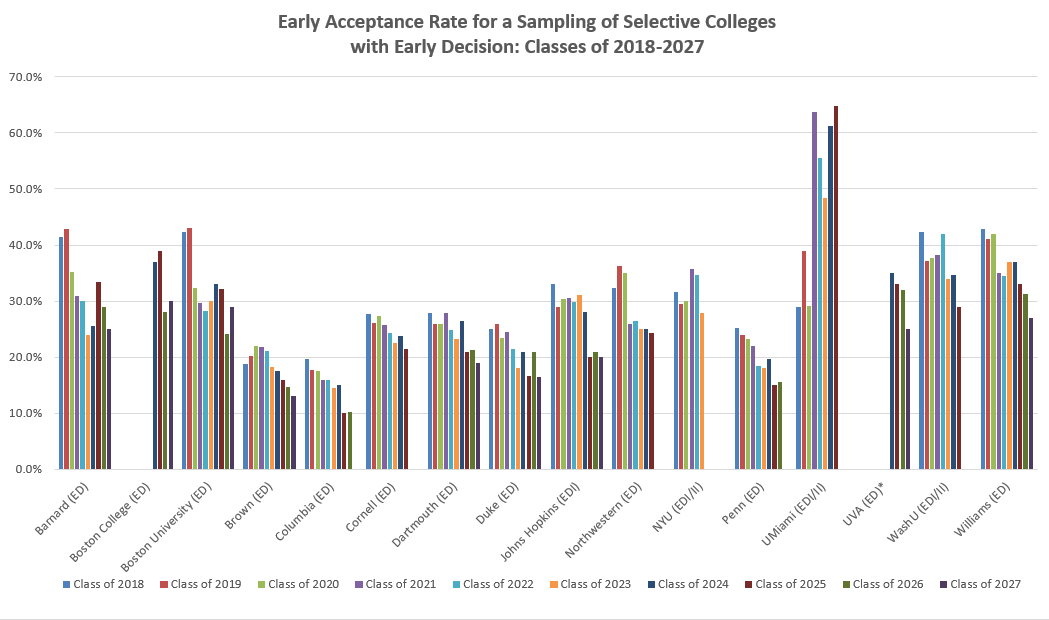
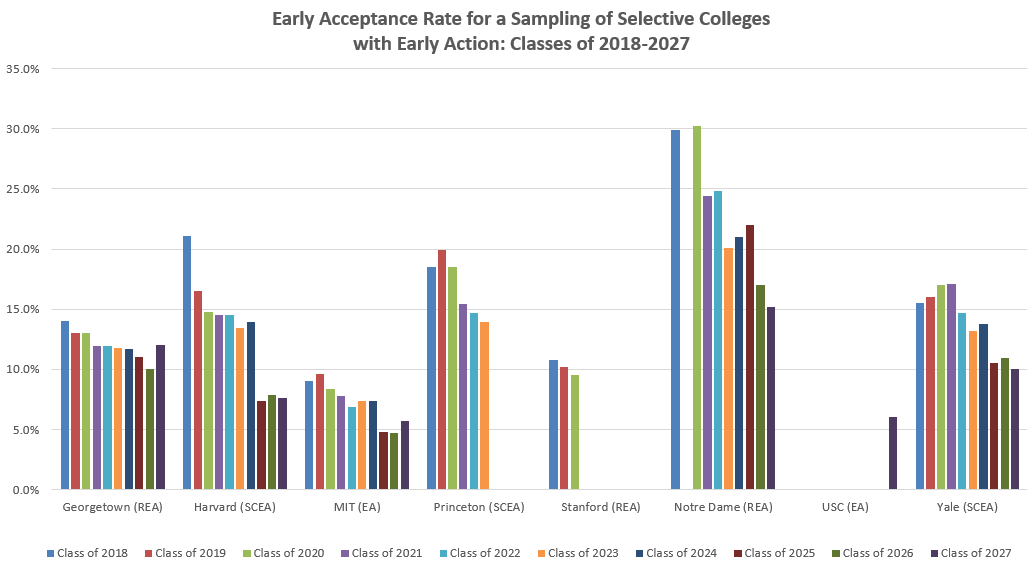
In general, ED acceptance rates have continued to decline, however, they remain significantly higher than Regular Decision acceptance rates. Several selective colleges broke school records with their low early acceptance rates, including Brown (13%), Dartmouth (19%), Duke (16.5%), Williams (27%), and Yale (10%). Two years ago, Harvard had its largest Early Action pool and lowest EA acceptance rate to date for the Class of 2025. However, this year Harvard’s results were still consistently crushing with its second-lowest ever EA acceptance rate of 7.56%. Stay tuned for our future blog post, comparing regular and early admissions.
Overall Early Application Numbers
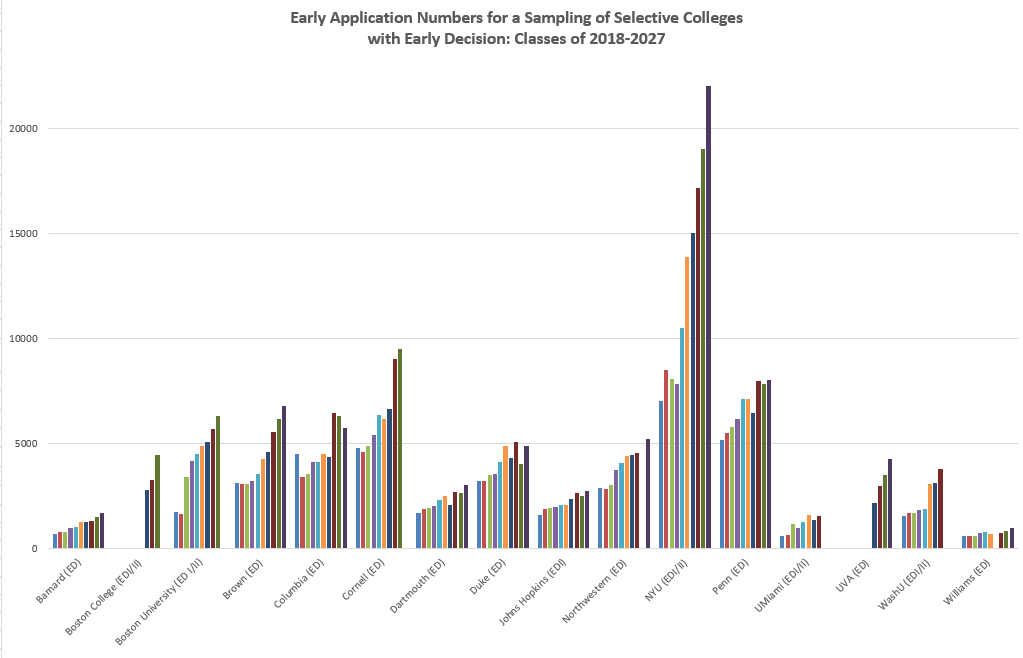
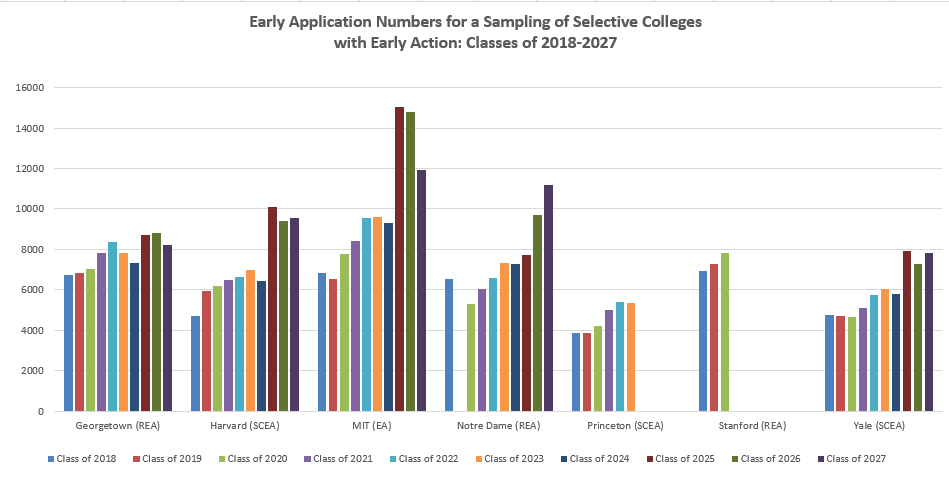
The following graph compares early admissions application numbers and acceptance rates for the Class of 2018 through 2027. As a refresher, Early Decision (ED) is binding and mandates enrollment; Single Choice Early Action (SCEA) and Restrictive Early Action (REA) are restrictive but allow the student to wait until May 1st to decide; and Early Action (EA) is unrestrictive and non-binding. Early Decision is typically associated with higher acceptance rates because the school is guaranteed the student’s enrollment, which increases the yield factor, and results in a class comprised of students who have demonstrated a high degree of interest.
Early Admissions Statistics for a Sampling of Selective Colleges
 .
.
*BC and UVA began ED programs in 2019
*Notre Dame changed its early admissions program from EA to REA in 2015.
*Princeton stopped releasing early stats in 2020, and Stanford ceased releasing early stats in 2017.
*USC began its EA program in 2022.
This year, UVA had a 25% overall ED acceptance rate, including a 31% in-state admit rate and a 17% out-of-state admit rate.
Notably, Notre Dame has a unique situation of not offering binding Early Decision, yet having an unusually high yield from their Restrictive Early Action. According to their admissions website, “Despite no binding agreement, close to 70 percent of REA admitted students typically enroll at Notre Dame.”
Deferral Stats
Deferral rates are not as widely published as acceptance rates. However, available information shows that many schools defer more than half of their early applicant pool to the regular admissions round.
Notable exceptions include Duke, Middlebury, Northwestern, Notre Dame, and Stanford, who deny most applicants who are not accepted in the early round. For these schools, deferral is used to indicate that your application is very competitive because if you are not in line with the school’s admissions standards you would be denied; therefore you will be given serious consideration in the regular admissions process.
Yale has lowered its rate of deferral the past two years. For the Class of 2025 and classes prior, close to 50% of early applicants were deferred. In contrast, last year 31% were deferred and this year, only 21% were deferred and 67% were denied. Brown has also decreased its deferral rate. For the Class of 2021, 60% of ED applicants were deferred; this year only 19% received deferral and 68% were denied.
Some schools, like the University of Michigan, use large numbers of deferrals to control class size as they have continued to receive increasingly large early applicant pools. Some colleges defer especially strong candidates who may view the college as a “safe” school, wait to see if the student withdraws the application based on early acceptance by more selective colleges, and then may accept the student late-January through March.
For deferred students, there are several steps you can take to increase your chances of admission in Regular Decision, including re-visiting, arranging for an additional letter of recommendation from a 12th grade teacher, and sending a follow-up letter with updates. Above all, stay positive, and continue to do your best academically.
Percent of Early Apps Deferred for Recent Classes

*Georgetown and USC defer all students who are not accepted EA
*As of the fall 2018, Stanford stopped releasing admissions data
*Princeton has not released deferral stats since 2014
Larger Percentages of Freshman Classes Filled with Early Applicants
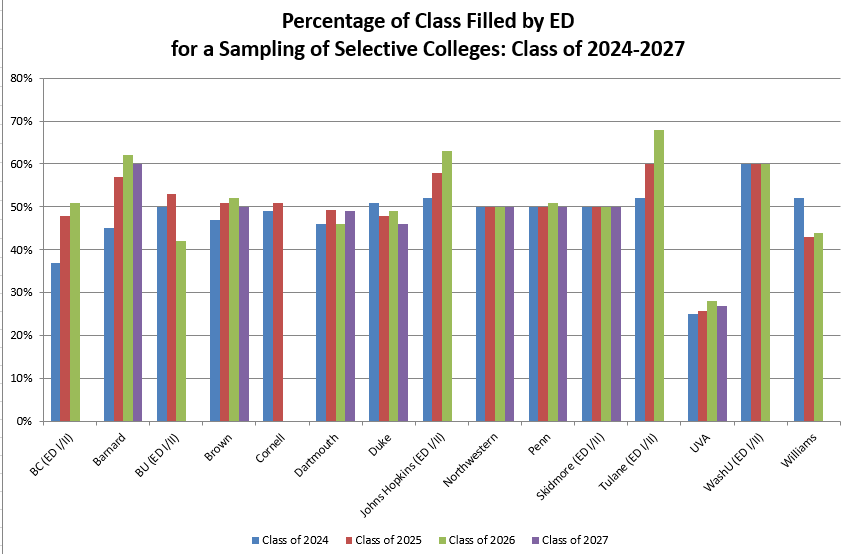
Some schools continue to admit large portions of the freshman class through Early Decision, making the regular admissions cycle even more competitive. More students tend to apply through Regular Decision, so they are competing for fewer remaining positions in the class.
Barnard, Boston University, Cornell, Dartmouth, Duke, Northwestern, Rice, Skidmore, Tulane, Penn, WashU, and Williams admit 40% or more of their incoming class through their Early Decision program. Several colleges, such as Dartmouth, Duke, Northwestern, Penn, and Skidmore, seem to be intentionally keeping the percent at or just under 50%, perhaps due to the negative optics of filling most of their class through Early Decision (which typically attracts upper socioeconomic applicants who do not need to compare financial aid offers). The chart below shows the percentage of recent classes filled with ED admits.
Increased Diversity Continues to be a Priority
Many of the most selective colleges continue to use early admissions for the big “hooks”: underrepresented minorities, lower socioeconomic, first-generation, and international students, as well as recruited athletes, and legacies. Schools with a high percentage of applicants who self-identify as students of color include Barnard (47%), Dartmouth (41%), Duke (52%), and Harvard (54%).
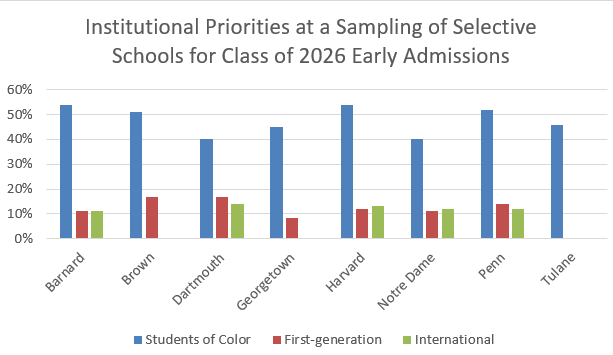
While many schools reported their stats regarding early acceptance for first-generation students and students of color, including Barnard (12%), Brown (15%), Dartmouth (15%), Harvard (14%), Johns Hopkins (17%), and WashU (13%), they significantly reduced their reporting of international students. See the charts below showing the published data on institutional priorities for the Classes of 2027 and 2026 for a select group of colleges, illustrating the decrease in reporting.
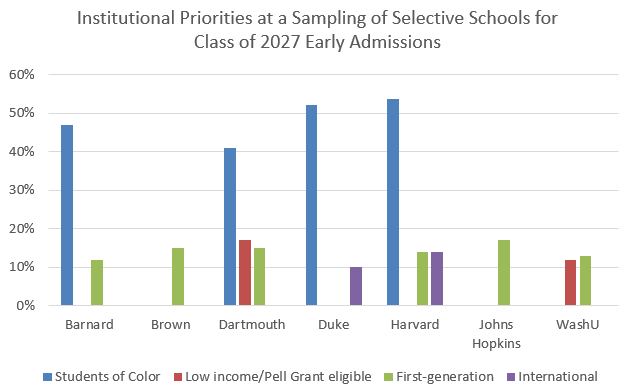
This year, in comparison to last year, colleges released less information about the diversity of their incoming early admits. Perhaps this is in part due to the current case against affirmative action at Harvard and UNC that will be heard by the Supreme Court.
If you applied early to a highly selective college and do not fall into one of these categories of institutional priority, your chances of admission are significantly lower than the published average admit rates.
Future Plans for Standardized Testing Admissions Policies
Most schools continued their test-optional admissions policies this year for the Class of 2027 admissions cycle. According to FairTest, for the 2023-24 admissions cycle over 1,750 schools will continue to have test-optional policies in place and 85 schools will be test-blind or score-free, which includes the California public university system.
Harvard has already announced that “due to the ongoing COVID-19 pandemic and its continued impact on access to testing for high school age students, Harvard College will allow students to apply for admission without requiring SAT or ACT scores for the upcoming admitted classes of ’27, ’28, ’29, and ’30.”
Georgetown is an anomaly in that it continues to require standardized test scores and is one of the few selective colleges that has not offered test-optional admissions. MIT brought back the requirement of standardized testing this admissions cycle, and their early apps fell by 19% compared to last year.
Not many schools have released their test-optional applicant stats for this admissions cycle yet. At Barnard, 53% of ED admits were test-optional, up from 49% last year.
More schools are also trending towards allowing superscoring of the ACT, in which the highest section scores are re-combined to form a new composite. Traditionally, most colleges have superscored the SAT, even before COVID.
We continue to recommend that students take standardized tests as part of the application process and submit scores if they are competitive. Keep in mind that test-optional is not the same as test-blind! Strong scores will still provide a competitive advantage in the admissions process.
School Policies on Sharing Early Admissions Stats
There is a growing divide in how colleges share their early admissions statistics. Schools like Brown, Dartmouth, Harvard, Williams, and Yale seem to share more information, such as application numbers, average admit test scores, deferrals, and institutional priorities, such as first-generation status. This transparency can often help future applicants determine how to apply and admission chances.
Yet other schools have begun to pull away from sharing this information, including Columbia, Cornell, Penn, Princeton, and Stanford.
In 2021, Princeton announced its reasoning for reducing the amount of information previously provided, stating:
We know this information raises the anxiety level of prospective students and their families and, unfortunately, may discourage some prospective students from applying. For this reason, we have in recent years stopped reporting the annual admission rate, as well as the admission rate by SAT score range and average GPA. We have now made the decision not to release admission data during the early action, regular decision and transfer admission cycles.
Similarly, Cornell adopted a policy to not share acceptance rates until after the admissions cycle has ended each year. As of the fall of 2018, Stanford stopped publishing admissions data.
Our Tips
We recognize how challenging the process of waiting for your admissions results is. Here are our tips to seniors for maximizing your chances:
- Send your #1 college (if you have a top choice) a Letter of Intent saying that you would attend if accepted (if you applied Early Action or Regular Decision)
- Send your other early admission colleges Letters of Continued Interest with updates about academics and activities
- Continue to engage in your academics; colleges want to see your midyear report and final report card
- Visit (or revisit) colleges in which you are most interested
- Keep a positive outlook and have faith in the process!
Deciding whether and where to apply early can be daunting, especially now. But whatever your question, Collegiate Gateway is happy to help you decipher your options and understand the changing landscape of early admissions.
![]()
![]()
![]()
![]()