 This is Part V of our series on Early Admissions for the Class of 2028. Take a look at Part I: Early Application Acceptance Rates for the Class of 2028 to understand overall trends in early applications and acceptance rates and Part II: Diversity to learn more about how colleges will pursue diversity after the Supreme Court ruling. Part III: Deferral Stats looks at trends in how schools have used deferrals over the past ten years, and Part IV: Who Benefits from Early Decision? examines the pros and cons of this early admissions program.
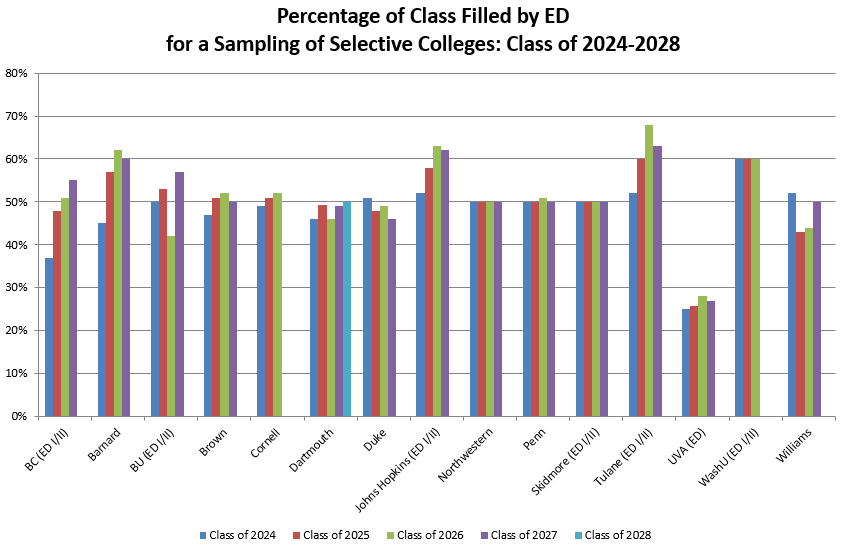
Many colleges are now filling at least 40% or more of their incoming first-year class through Early Decision. This leaves significantly fewer spots for the vastly greater numbers of students who apply through Regular Decision.
For example, at Boston College, 4,433 ED applications were submitted for the Class of 2027, and 30% were accepted, filling about 55% of BC’s incoming first-year class. That means that the significantly larger regular pool must compete for the remaining spots. 32,092 students applied in Regular Decision, and only 13% were admitted. This year, BC admitted 34% of ED applicants from a pool of 2,800, which will make up half the incoming class, according to BC admissions.
Tulane paints an even more shocking picture of early vs. regular admissions. For the Class of 2026, Tulane admitted only 106 students through Regular Decision. 1,258 ED I/II applicants were admitted making up 68% of Tulane’s Class of 2026, and 2,249 early action applicants were admitted. For the Class of 2027, Tulane filled 63% of the class through EDI/II, 697 EA applicants enrolled, and 207 RD applicants were admitted. This breaks down to the following acceptance rates for the Class of 2027 at Tulane: ED-68% accepted, EA-17%, and RD-3%. This averages into an overall acceptance rate of 15%, but as you can see if you apply ED your odds improve exponentially and if you’re going to apply RD—well, you can decide for yourself if that’s worth your time!
See the chart below for the percentage of the first-year class filled through ED for a select group of colleges.
The discrepancy between the numbers of applicants and the review time for ED versus RD can affect the quality of review of an applicant’s file in the RD round. On the one hand, admissions officers have about twice as much time to review applications in the Regular Round, as they typically have three months for RD applications, from January 1 through April 1, and 1 ½ months for ED applications, from November 1 – December 15. But if the admissions staff receive a whopping 7x as many RD applications, as in Brown’s case last year, the review process will be much more compressed, and students who have a unique story to tell may not receive the same quality of consideration.
The college admissions process can be overwhelming, and it may feel difficult to know where to start. At Collegiate Gateway, we are eager to share our expertise and guide you on the path to your “best fit” college. Please feel free to contact us! As always, we’re happy to help!
![]()
![]()
![]()
![]()